"Bungee Barbie" - Jumping Into Linear Equations 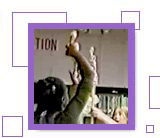
At Chauncey Rose Middle School, we teach Algebra to all 8th graders,
including special needs students. We feel that every student has the right
to what we call the "gateway to mathematics." Obviously, the lecture method
does not work with all students - therefore we do many "hands-on" activities
that incorporate as many of my students' different learning styles and
intelligences as possible. I also want to prove to them that you really
can use algebra in the real world!
When we began to study linear equations I heard the usual question,
"How are we ever going to use this?" I decided to do an activity that
would show them linear equations in action. The "Bungee Barbie" activity
came from a workshop led by John LeMasters. As part of this activity I
want my students to question how we can tell whether change is predictable
when two related quantities change. I want them to be able to answer how
a graph can be made from a table of specific values to help them predict
other values and to know how accurate such predictions can be. Most importantly,
I want my students to know what kinds of everyday problems can be solved
by using mathematical tables and graphs.
With "Bungee Barbie," students were asked by the Daredevil Entertainment
Company to undertake the task of working out the details of a new bungee
jumping venture. The students and I had a lively discussion on who had
bungee jumped before and what they would look for in a company before
they actually jumped. They said that obviously safety was the first concern.
They would want to make sure the equipment was strong and that the bungee
cord would be the right length. I asked them how the company would determine
the correct length and they responded that it would depend on how tall
a person was or how much the person weighed. Eric explained it in his
final report, saying, "We believed that weight was important because in
an actual business setting you would have to know how much the person
weighed. It's a difficult process. You wouldn't want a customer hitting
their head and causing death. It's just not good business!"
I explained to them that we were going to conduct an experiment. Each
team was going to work with a Ken or Barbie doll to determine the ultimate
length, or number of rubber bands (x-coordinate or independent variable)
that could be used with Ken or Barbie at any given height and not cause
any type of injury or death.
On the first day of the project, the students collected data. I walked
around with a video camera recording the students at work and questioning
them about their understanding. In their small groups, they created a
table by recording three trials using an increasing number of rubber bands
as bungee cords for Barbie as she "jumped" from the top of a meter stick.
They started to recognize linear relationships from their tables, seeing
that for each unit change in one variable there is a nearly constant rate
of change in the other variable.
On day two, the student analyzed the data by finding the averages of
the three trials at each number of rubber bands, completing the graph
and making a prediction for the actual bungee jump from 762 centimeters
(the height of our school roof). Again the discussion became lively as
I asked them if they should use the actual 762 centimeters as the ultimate
goal of the jump. One student, with the typical 8th grader attitude, said
"Yeah, right Mrs. L., then you would have the ultimate death!" The students
came to the conclusion that 760 would be the right goal. You would not
"splat" yourself on the ground but you would retain the full thrill of
the jump. They also began determining whether a set of data is linear
by examining its graph. Stephanie realized that by following the straight
line on the graph she could make a prediction of the number of rubber
bands needed for the jump.

Day three was THE JUMP! After making the prediction of how many rubber
bands it would take to jump Barbie off the roof of our school building,
the students prepared the dolls for the jump. The janitor took the dolls
up to the roof and one by one the dolls completed the jump. There were
exclamations of disappointment when a student's particular doll did not
go as far as the group had predicted. Zach wrote in his final report that
"�we calculated how much the increment would be for every rubber band
until we got to 762 cm. One variable is when we did the minor testing,
we only tested six rubber bands. If we could have tested seven or eight,
the outcome would have been better." Mike wrote, "On the day of the jump
we discovered that ourselves and most of our peers had made a major mistake
in some way, because many of the dolls only went down about half as far
as we had hoped. Later, when we discussed in class what we thought had
gone wrong, many different issues came up. We know now that we didn't
tie all the rubber bands together with the same amount of quality. So
we concluded that if we had the chance to do this experiment again we
would be more careful going about our work than we did this time." Another
group wrote that they did not pay close enough attention to what their
graph said and they found that their estimate came up very short.
All groups said it was a fun project and they definitely wanted the chance
to do it again.
- Marylin Leinenbach
Chauncey Rose Middle School
Terre Haute, IN
Leinenba2@aol.com
Learning Goals for the "Bungee Barbie" Activity
The substantive mathematical idea of this instructional sequence is
linear functions and relationships. My learning goals for the project
are:
 |
|
1. Have students continue to develop their understanding of variables
and patterns.
2. Have students recognize and represent the relationships among
variables in a variety of ways, including the use of words, tables,
graphs and symbols.
3. Have students identify variables and determine an appropriate
range of values for independent and dependent variables.
4. Have students collect data and use patterns in tables and graphs
to make predictions.
5. Have students recognize that linearity is associated with a constant
rate of change between two variables.
6. Have students understand that this change can be predictable.
7. Have students understand that this change can be expressed as
a mathematical equation.
|
|
|
|